HealthFrame Charts & Graphs
HealthFrame provides a wealth of charts & graphs to help see and understand progress on various
numerical measures of health or growth, such as weight, height, cholesterol, etc.
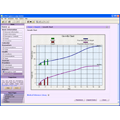
Childhood Growth Chart
Here you will see the height and weight information for this person, from
birth to age 20. In addition to their height and weight, you will see a
reference curve for the median normal weight – as defined by the CDC (Centers for Disease Control and Prevention- http://www.cdc.gov)
|
|
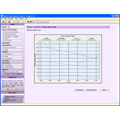
Blood Lipids (Cholesterol) Chart
Review changes in your cholesterol level, HDL, LDL, and triglycerides.
|
|
Weight Chart
Use the weight chart to measure your progress losing (or gaining, in the case of pregnancy) weight.
|

|
More Charts & Graphs
And of course, many more...
|
More ...